

What’s Really in Your Glass? How Analytical Chemistry Reveals What is in Your Glass
Analytical chemistry examples, methods and real-life applications, from tap water to the surface of Mars
A glass of water looks the same whether it’s perfectly safe or quietly carrying enough lead to harm a child. Same clarity. Same lack of smell. Same taste, or lack of one. Your senses are useless here, and that is exactly the moment analytical chemistry walks in.
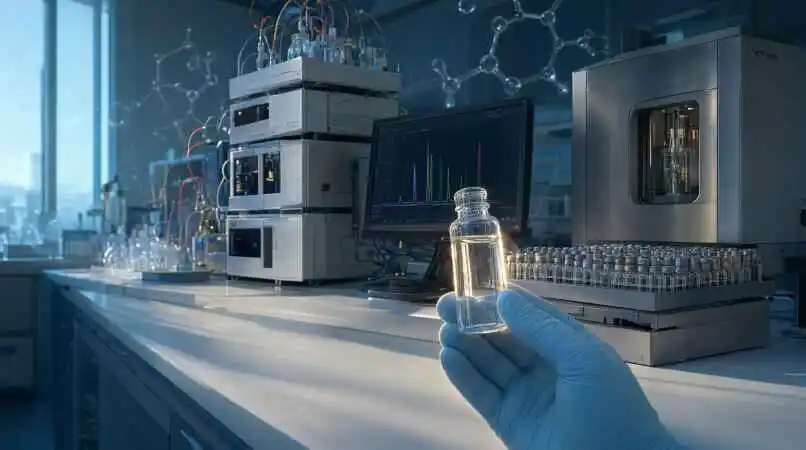
Picture a municipal water lab on a Monday morning. A technician lifts a sealed bottle out of a courier box, checks the label against a chain-of-custody form, and loads a few milliliters into an instrument about the size of a dishwasher. Twenty minutes later a number appears on a screen: 4.2 micrograms per liter of lead. Below the guideline. Batch cleared. Nobody outside that lab will ever think about the number again, which is how it should be.
Now multiply that scene by millions. Every tablet you swallow was tested before it reached a pharmacy shelf. The glucose strip, the milk your kids drink, the petrol in your tank, the urine samples an athlete hands over after a race: all of it depends on someone answering two deceptively simple questions. What is in this sample, and how much of it is there?
This guide walks through the field properly. You’ll get the logic behind qualitative and quantitative analysis, the five-step workflow every lab follows, the analytical techniques that do the heavy lifting, three worked analytical chemistry examples with real numbers, and the real-life applications of analytical chemistry that touch your day far more often than you’d guess. Whether you’re a student wrestling with a syllabus, someone eyeing a lab career, or just curious how anyone knows a jar of honey is honest, there’s something here for you.
What Analytical Chemistry Actually Is (and isn’t)
Most people picture chemistry as a place where things get made: new drugs, shiny polymers, something bubbling dramatically in a flask. Analytical chemistry is the quieter sibling that measures. If a synthetic chemist builds the bridge, the analytical chemist is the engineer who checks it will hold the load, and tells you honestly by how much.
A working definition worth memorizing: analytical chemistry is the science of identifying what a sample contains and measuring how much of each component is present. Everything else, the instruments, the software, the mountain of acronyms, exists to answer those two questions faster, cheaper, and with more confidence.
Qualitative and Quantitative Analysis: The Two Core Questions
Every analysis falls into one of two camps, and most real projects need both.
| Type | The question | Everyday example | Typical technique |
| Qualitative | What is present? | Is this white powder aspirin or something else? | IR spectroscopy, mass spectrometry |
| Quantitative | How much is there? | How much caffeine is in this cup of coffee? | HPLC, UV-Visible spectroscopy |
| Both together | What, and how much? | Which pesticides are on this tomato, and are they under the legal limit? | LC-MS/MS, GC-MS |
A pesticide lab shows the pattern well. First the analyst has to work out which compounds are in a vegetable extract (qualitative), then whether any of them exceed the legal limit (quantitative). Skip the first step and you risk measuring the wrong thing very precisely.
Accuracy, Precision, and the Dartboard
Imagine throwing four darts at a board. The picture explains more than a page of definitions could.
- Accurate and precise: the darts cluster tightly around the bullseye. This is the goal.
- Precise but not accurate: a tight cluster in the top-left corner. Think of a kitchen scale that always reads 20 grams heavy. Consistent, and consistently wrong.
- Accurate but not precise: darts scattered around the bullseye. The average is right, but any single throw can’t be trusted.
- Neither: darts everywhere. Time to check the equipment, the technique, or both.
Analysts fix bias with calibration and reference materials, and tame noise with careful technique and replicate measurements. Both matters, and one never excuses the other.
A number without an uncertainty is just an opinion with decimals.
Making Sense of ppm, ppb, and ppt
Trace analysis lives in tiny units, and it helps to attach each one to something you can picture.
| Unit | In water | Picture it |
| 1 ppm | 1 mg per liter | One drop in about 50 liters, roughly a large bin |
| 1 ppb | 1 µg per liter | One drop in about 50,000 liters, a backyard swimming pool |
| 1 ppt | 1 ng per liter | One drop in about 50 million liters, around 20 Olympic pools |
Modern instruments reach the ppb and even ppt range for many elements. That sensitivity is the reason a lab can tell you a child’s drinking water is safe, or that it isn’t, when nothing about the glass gives it away.
The Analytical Workflow: Five Steps Every Lab Follows
Walk into any analytical lab, from a university teaching bench to an accredited pharma facility, and you’ll notice the same rhythm. The instruments differ. The logic doesn’t.
Step 1: Define the Question and Collect a Representative Sample
Here’s the uncomfortable truth many beginners miss: the best instrument in the world can’t rescue a bad sample. Test a grain silo by scooping from the top and you’ve measured the top. In practice, sampling error often outweighs the error of the measurement itself.
- Write down the decision the result will support (pass or fail against a limit, process control, research) before you collect anything.
- Take several increments from different locations and combine them, rather than relying on one grab.
- Match the container to the job: glass for most organics, acid-washed plastic for trace metals.
- Preserve the sample properly: cool it, acidify it, or analyze it quickly, depending on the analyte.
- Document everything. Chain of custody matters the moment a result is challenged.
Step 2: Sample Preparation
Real samples are messy. Blood carries proteins, soil carries clay, ketchup carries everything. Sample preparation turns that mess into something an instrument can handle: dissolving, digesting, extracting, filtering, diluting, or concentrating. It’s rarely glamorous, and it often eats the biggest share of the working day.
Take a tomato headed for a pesticide lab. A widely used approach called QuEChERS (quick, easy, cheap, effective, rugged and safe) homogenizes the fruit, extracts it with acetonitrile and salts, then cleans the extract so the instrument isn’t swamped by sugars and pigments. For metals in soil, the analyst might digest the sample in hot acid so every metal atom ends up dissolved and countable.
Step 3: Measurement and the Calibration Curve
Instruments don’t print concentrations. They produce signals: absorbance, peak area, current, ion counts. To translate signal into amount, analysts build a calibration curve. They run standards of known concentration, plot signal against concentration, and then read the unknown sample’s signal off that line.
- Run a blank first to see the instrument’s background signal.
- Prepare at least five standards that bracket the concentration you expect in the sample.
- Check linearity. A correlation coefficient close to 1 is a start, not proof, so look at the residuals too.
- Add an internal standard, a known compound spiked into every sample, to correct for drift and losses.
- Re-check mid-run with a control standard so you catch problems before they spoil a whole batch.
Step 4: Data Processing and Validation
A raw result becomes a trustworthy one only after validation. Labs check recovery (spike in a known amount and see how much comes back), repeatability (same sample, same day, several times), and the limits of detection and quantification. A method that can’t reliably see the level that matters is useless, however elegant it looks.
Step 5: Report the Result Honestly
A proper report states the value, units, uncertainty, method, and date, and ties back to the sample’s documented history. In regulated work, a colleague should be able to pick up your file five years later and reproduce every number. That traceability is the quiet backbone of the whole discipline.
Putting It Together: One Sample, Start to Finish
Let’s follow the water sample from the opening of this guide. A field technician fills an acid-washed bottle at a household tap after the water has sat overnight, adds a drop of nitric acid to keep the metals dissolved, and seals it. At the lab the bottle is logged, given a number, and stored cool. The analyst filters a portion, adds an internal standard, and loads it onto the ICP-MS alongside a blank, a series of calibration standards, and a certified reference water with a known lead content.
The reference water comes back inside its acceptable range, so the run is valid. The sample reads 4.2 µg/L with an uncertainty of a few tenths. The report goes out with the number, the units, the method reference, and a sign-off. Every step from bottle to report exists to make one sentence defensible: this household’s water contained 4.2 µg/L of lead on that date, measured by this method.
| PRACTITIONER TIP |
| When a result looks strange, check the sample and the preparation before you blame the instrument. In most labs, that’s where the problem lives. |
Analytical Techniques: From Classical Methods to Modern Instruments
There are hundreds of analytical techniques, but a manageable handful do most of the world’s work. Knowing what each one is good at is half the battle of choosing well.
Classical Methods That Still Earn Their Keep
Before instruments, there were beakers, balances, and patience. Titration measures an unknown by reacting it with a solution of known concentration until the reaction is exactly complete, usually flagged by an indicator changing color. Gravimetric analysis weighs a precipitate or residue, so the answer rests on mass alone. The Kjeldahl method, devised by Danish chemist Johan Kjeldahl in 1883, converts nitrogen in food into ammonia and titrates it. It still underpins protein measurement in food labs today.
Why keep them around? They’re cheap, robust, and traceable to fundamental quantities. Many reference methods still lean on them.
Water hardness is a classic example. Calcium and magnesium are titrated with EDTA, which binds both metals tightly, and an indicator such as Eriochrome Black T flips from wine red to blue at the endpoint. It’s a ten-minute test that tells a household whether scale is about to clog the kettle.
Spectroscopy: Reading What Light Tells Us
Spectroscopy studies how matter interacts with light. Each technique asks a slightly different question.
- UV-Visible spectroscopy: measures how much light a colored or UV-absorbing solution soaks up. Under the Beer–Lambert law, absorbance rises in proportion to concentration. A workhorse for nitrate, iron, proteins, and dyes.
- Atomic absorption (AAS) and ICP techniques: turn the sample into free atoms in a flame or a plasma hotter than the surface of the Sun, then measure the light atoms absorb or emit. ICP-MS goes further and counts the ions, reaching parts-per-trillion levels for many metals.
- Infrared (IR) spectroscopy: reads molecular vibrations to reveal functional groups, giving a fingerprint for identifying plastics, fibers, and drug tablets.
- NMR spectroscopy: maps how atomic nuclei sit inside a molecule, the gold standard for working out structure. The same physics powers MRI scanners.
- Fluorescence: extremely sensitive for compounds that glow under light, such as riboflavin and certain mould toxins.
Chromatography: Separating a Crowd
Real samples are mixtures, and mixtures confuse detectors. Chromatography separates the components so each can be measured on its own. The sample travels through a column carried by a mobile phase (a gas or a liquid), and components that cling harder to the column material lag behind. Each compound emerges at a characteristic retention time, which is half of its identity.
- Gas chromatography (GC): for volatile compounds such as solvents, fragrances, fuel components, and residual solvents in medicines.
- High-performance liquid chromatography (HPLC): for non-volatile or heat-sensitive molecules, pushing liquid through the column at high pressure. It’s the backbone of pharmaceutical work.
- Thin-layer chromatography (TLC): a cheap plate-based method, handy for quick checks and teaching.
- Ion chromatography: for ions like nitrate, fluoride, and chloride in water.
Mass Spectrometry: Weighing Molecules
Mass spectrometry ionizes molecules and sorts the ions by mass-to-charge ratio. The resulting spectrum works like a molecular passport, giving molecular weight and fragmentation patterns that point to structure. Pair it with a separator and you get the powerhouse combinations GC-MS and LC-MS/MS, which can pick out a single compound from a crowded food extract or a urine sample at vanishingly small concentrations.
People often talk about chromatography and spectroscopy as a pair, and the partnership makes sense. One sorts the crowd. The other interviews each person.
Chromatography sorts the crowd. Spectroscopy and mass spectrometry interview each person.
Electrochemical Methods
Your pH meter, the fuel cell inside a breathalyzer, and the glucose strip a relative uses every morning are all electrochemical. They convert a chemical reaction into an electrical signal. They’re cheap, compact, and fast, which is why they dominate point-of-care and field testing.
Quick Comparison of Common Techniques
| Technique | Best for | Typical range* | Everyday example |
| Titration | Major components, acids, bases | ppm to % | Acidity of vinegar |
| UV-Visible | Colored or UV-absorbing species | ppm | Nitrate or iron in water |
| AAS | One metal at a time | ppm to ppb | Lead in paint or water |
| ICP-MS | Many trace metals at once | ppb to ppt | Arsenic in rice |
| GC-MS | Volatile organic compounds | ppb | Arson accelerants, flavors |
| HPLC / LC-MS/MS | Drugs, pesticides, toxins | ppm to ppt | Drug purity, antibiotics in milk |
| Electrochemical | Ions, gases, glucose | Varies | Glucose meter, pH probe |
*Ranges are rough guides. Real limits depend on the instrument, the method, and the sample matrix.
How to Choose a Technique
- What do you need to know: identity, amount, or structure?
- How much analyte do you expect, and how low must you measure?
- How messy is the sample matrix? Milk and wastewater fight back; clean water doesn’t.
- What do speed, cost, and available skills allow?
- Does a regulator or standard already specify the method?
| REAL-WORLD EXAMPLE
A lab asked about arsenic in rice might start with ICP-MS to get the total arsenic figure. But inorganic arsenic is more toxic than the organic forms, so a regulator-minded lab may couple HPLC to ICP-MS to separate the species first. Same element, different question, different technique. |
Real Life Applications of Analytical Chemistry
Textbooks make this field sound abstract. Out in the world, it looks like the following.
Healthcare and Clinical Diagnostics
When a doctor orders blood work, a clinical chemistry analyzer measures glucose, electrolytes, creatinine, cholesterol, and dozens of other markers using photometry and ion-selective electrodes. HbA1c, the three-month marker used in diabetes care, is commonly measured by HPLC. Newborn screening takes a few drops of blood on a card and uses tandem mass spectrometry to check for dozens of rare metabolic disorders, catching conditions early enough to treat them before damage is done. And the glucose meter at home? A tiny enzyme-based electrochemical sensor, doing analytical chemistry on a single drop.
Food Safety Testing and Authenticity
Food safety testing is where analytical chemistry meets public trust. Labs check for pesticide residues, heavy metals, mycotoxins, antibiotics, allergens, and illegal dyes. The 2008 melamine scandal in China is a textbook case for why method choice matters. Protein is commonly estimated from nitrogen content, and melamine is packed with nitrogen, so adulterated milk looked protein-rich on routine tests while carrying a toxic additive. More specific methods such as LC-MS exposed the fraud.
Authenticity is the other half of the job. Is that honey really honey? NMR and isotope-ratio mass spectrometry can flag cheap sugar syrups, because the carbon isotope signature of cane sugar and corn syrup differs from that of most floral nectar. Olive oil, saffron, spices, and basmati rice get similar scrutiny.
Environmental Monitoring
Water utilities measure lead, arsenic, nitrate, fluoride, and disinfection by-products. The WHO guideline value for both lead and arsenic in drinking water is 10 micrograms per liter, a level only trace techniques such as ICP-MS can verify with confidence. Air monitors track particulates, ozone, nitrogen oxides, and carbon monoxide. Soil labs check for pesticides and heavy metals before land is farmed or built on. When the Flint, Michigan water crisis unfolded in 2014 and 2015, independent sampling and laboratory analysis of household water backed up what residents had been saying for months.
Pharmaceutical Analysis
Every batch of every medicine passes through quality control before release. Pharmaceutical analysis relies on HPLC to confirm the active ingredient is present at the labelled strength (assay), to hunt for impurities and degradation products, and to check that a tablet dissolves and releases its drug at the right rate. In 2018, nitrosamine impurities turned up in valsartan blood-pressure tablets, and later in other medicines such as ranitidine. Sensitive GC-MS and LC-MS methods found contaminants at levels most routine tests would never see, and recalls followed.
Forensics and Sport
Forensic labs use GC-MS to identify accelerants in fire debris, headspace GC to measure blood alcohol, and LC-MS/MS to identify drugs and poisons in biological samples. IR and microscopy help match paint chips, fibers, and glass. In sport, anti-doping laboratories screen urine and blood for hundreds of banned substances and their metabolites, mostly with GC-MS and LC-MS/MS, often at nanogram-per-milliliter levels or lower.
Agriculture and Soil Health
Farmers rarely think of themselves as customers of analytical chemistry, but soil tests drive many of their decisions. Labs measure pH, organic carbon, nitrogen, phosphorus, potassium, and micronutrients such as zinc and boron, then translate the numbers into fertilizer recommendations. Spend according to a soil report and you avoid both underfeeding the crop and washing excess nitrate into rivers. Analytical methods also screen stored grain for aflatoxin, a mould toxin that thrives in poor storage, and check milk for antibiotic residues so treated animals don’t enter the food chain too soon.
Industry, Art, and Even Mars
- Fuel and petrochemicals: GC maps the composition of petrol and diesel, and regulated limits on sulfur are checked routinely.
- Metals and alloys: optical emission spectrometry confirms steel grades in minutes on the foundry floor.
- Electronics: ultra-pure chemicals for chip-making are verified at trace levels, often with ICP-MS.
- Art and archaeology: X-ray fluorescence identifies pigments without harming a painting, and radiocarbon dating by accelerator mass spectrometry dates organic artefacts.
- Space: NASA’s Curiosity rover carries a GC-MS inside its SAM instrument, analyzing Martian soil and rock for organic compounds.
Analytical Chemistry Examples Worked Step by Step
Theory sticks better when you run the numbers. Here are three analytical chemistry examples from everyday analysis that you can follow with a calculator.
Example 1: Titration of Vinegar
The problem: A 10.00 mL sample of vinegar is titrated with 0.500 M sodium hydroxide using phenolphthalein as the indicator. The faint pink endpoint appears after 16.60 mL of NaOH. What is the acetic acid content?
- Moles of NaOH = 0.01660 L × 0.500 mol/L = 0.00830 mol.
- Acetic acid reacts 1:1 with NaOH (CH₃COOH + NaOH → CH₃COONa + H₂O), so the sample held 0.00830 mol of acetic acid.
- Concentration = 0.00830 mol ÷ 0.01000 L = 0.830 M.
- Mass per liter = 0.830 mol/L × 60.05 g/mol ≈8 g/L.
- That is about 4.98 g per 100 mL, or roughly 5% w/v acetic acid, which matches a typical table vinegar label.
Example 2: Iron in Groundwater with a Calibration Curve
A lab uses the 1,10-phenanthroline method, which turns dissolved iron into an orange-red complex that absorbs near 510 nm. The standards give these readings:
| Iron (mg/L) | Absorbance |
| 0 | 0.002 |
| 1 | 0.101 |
| 2 | 0.199 |
| 4 | 0.402 |
| 6 | 0.598 |
The line of best fit comes out close to A = 0.0996 × C + 0.0015. A groundwater sample, diluted 1 to 5 to bring it into range, reads an absorbance of 0.257. So, the diluted sample holds (0.257 − 0.0015) ÷ 0.0996 ≈ 2.57 mg/L. Multiply by the dilution factor of 5 and the original groundwater contains about 12.8 mg/L of iron, far above the 0.3 mg/L aesthetic limit commonly cited for drinking water.
Two lessons hide in that little calculation. Dilute so the sample lands inside the calibrated range, and never extrapolate beyond your highest standard.
Example 3: Detection and Quantification Limits
Suppose repeated blank readings in the iron method show a standard deviation of 0.0008 absorbance units, and the slope is 0.0996 absorbance units per mg/L.
- Limit of detection (LOD) = 3.3 × 0.0008 ÷ 0.0996 ≈027 mg/L
- Limit of quantification (LOQ) = 10 × 0.0008 ÷ 0.0996 ≈080 mg/L
In plain terms, the method can notice iron down to roughly 0.03 mg/L but only report a dependable number from about 0.08 mg/L upward. The 0.3 mg/L guideline sits comfortably above the LOQ, so the method is fit for purpose.
Common Mistakes, Quality Control, and Where the Field Is Heading
Mistakes That Quietly Wreck Good Data
- Sampling from a spot that isn’t representative of the whole batch.
- A fingerprint, dirty glassware, or reagents carrying trace metals can ruin ppb work.
- Ignoring the matrix. A method validated in clean water may fail in wastewater or milk.
- Extrapolating past the calibration range.
- Rounding too early or carrying the wrong number of significant figures.
- Skipping blanks and control standards.
- Trusting the software’s automatic peak integration without looking at the raw peaks.
Why Uncertainty Is Not a Weakness
New analysts sometimes feel that reporting an uncertainty makes a result look shaky. It does the opposite. Suppose the legal limit is 10 µg/L and your result is 9.6 ± 0.8 µg/L. The honest conclusion isn’t “pass.” It’s that the sample is too close to call without more work, or without a decision rule agreed in advance.
Uncertainty stacks up from every stage: sampling, preparation, calibration, instrument noise, even the purity of the standards. Labs combine these contributions mathematically into one figure. The habit of asking “how sure are we?” is what separates a measurement from a guess.
Quality Systems That Make Results Believable
Credible labs follow frameworks such as ISO/IEC 17025, the international standard for the competence of testing and calibration laboratories. In India, accreditation against it is handled by NABL. They use certified reference materials (samples whose composition has been independently established), join proficiency testing schemes where many labs analyze the same blind sample, and keep documentation tight enough that every result can be traced. Good laboratory practice is boring on purpose.
Where the Field Is Heading
- Portable instruments: handheld XRF, portable Raman, and miniaturized GC are moving analysis out of the lab and into fields, factories, and checkpoints.
- Ambient mass spectrometry: analyses samples with little or no preparation.
- Lab-on-a-chip and paper sensors: cheap, fast, point-of-care diagnostics.
- Machine learning: helps with peak identification, spectral matching, and method optimization.
- Green analytical chemistry: cuts solvent use and waste without giving up quality.
A Practical Way to Start Learning
- Get comfortable with basic statistics: mean, standard deviation, and confidence intervals.
- Do a few titrations by hand. Nothing teaches endpoints and error like a burette.
- Work through the Beer–Lambert law and build a calibration curve yourself.
- Get hands-on time with HPLC or GC through a lab course or internship.
- Read a method-validation guideline such as ICH Q2 so the vocabulary stops feeling foreign.
- Practice reading real chromatograms and mass spectra. Pattern recognition grows with exposure.
| CAREER NOTE
Analytical chemists work in pharma quality control, food and environmental testing labs, forensic services, clinical laboratories, and instrument companies. If you build one skill first, make it statistics. It transfers to every one of those jobs. |
FAQs
Q1. What is analytical chemistry in simple words?
Analytical chemistry is the branch of chemistry that figures out what a sample contains and how much of each substance is in it. It’s the science behind water-quality reports, drug testing, food labels, and medical lab results.
Q2. What are the main branches of analytical chemistry?
The field is usually split into qualitative analysis (what is present) and quantitative analysis (how much). Methods are also grouped as classical, such as titration and gravimetry, and instrumental, such as spectroscopy, chromatography, and mass spectrometry.
Q3. What is the difference between qualitative and quantitative analysis?
Qualitative analysis identifies the components of a sample, for example confirming that a tablet contains paracetamol. Quantitative analysis measures the amount, for example 500 mg per tablet. Most real projects need both.
Q4. What are some everyday examples of analytical chemistry?
Glucose meters, breathalyzers, water-quality reports, fuel quality checks, pregnancy tests, nutrition labels, and the quality control of every medicine you buy all rely on analytical chemistry.
Q5. What is the difference between accuracy and precision?
Accuracy is how close a result is to the true value. Precision is how closely repeated results agree with each other. A method can be precise but biased, or accurate on average but noisy. Good analysis needs both.
Q6. What is a calibration curve and why do we need one?
A calibration curve plots instrument signal against known concentrations of standards. Because instruments output signals rather than concentrations, the curve lets you convert an unknown sample’s signal into an amount.
Q7. What is titration?
Titration is a method where a solution of known concentration is added to a sample until the reaction is exactly complete. From the volume used, you calculate how much analyte was present. It’s common for acids, bases, hardness, and vitamin C.
Q8. What is the difference between an endpoint and an equivalence point?
The equivalence point is the theoretical moment when reactants are present in exactly the right ratio. The endpoint is what you actually observe, such as an indicator color change. A good indicator makes the two very close.
Q9. What is spectroscopy used for?
Spectroscopy studies how matter interacts with light to identify substances, measure concentrations, or work out molecular structure. Examples include UV-Visible for nitrate, IR for plastics, and NMR for organic structures.
Q10. What is the Beer–Lambert law?
It states that the absorbance of a solution is proportional to the concentration of the absorbing species and the path length of light through it. It’s the foundation of quantitative UV-Visible analysis.
Q11. What is chromatography?
Chromatography separates the components of a mixture as they travel through a column or plate at different speeds. Each component exits at a characteristic retention time, so it can be identified and measured individually.
Q12. What is the difference between GC and HPLC?
Gas chromatography suits volatile, thermally stable compounds and uses a gas as the mobile phase. HPLC suits non-volatile or heat-sensitive compounds and uses a pressurized liquid. Pharma labs lean heavily on HPLC.
Q13. What is mass spectrometry?
Mass spectrometry ionizes molecules and separates the ions by mass-to-charge ratio. The spectrum gives molecular weight and fragmentation clues, making it one of the most powerful tools for identifying unknown compounds.
Q14. Why is LC-MS/MS so popular?
It combines liquid chromatography’s separating power with the selectivity and sensitivity of tandem mass spectrometry. It can quantify trace compounds such as drugs, pesticides, and toxins in complicated samples like blood, urine, and food.
Q15. What is the difference between AAS and ICP-MS?
Atomic absorption usually measures one element at a time and is cheaper and simpler. ICP-MS measures dozens of elements at once at far lower concentrations, but the instrument costs more and needs more expertise.
Q16. What is sample preparation and why does it matter?
Sample preparation converts a raw sample into a form an instrument can analyze, through steps like digestion, extraction, filtering, and dilution. Errors here are among the biggest sources of bad results, and it often takes most of the analysis time.
Q17. What are LOD and LOQ?
The limit of detection is the lowest amount a method can reliably distinguish from nothing. The limit of quantification is the lowest amount it can measure with acceptable accuracy and precision. LOQ is always higher than LOD.
Q18. What is an internal standard?
An internal standard is a known compound added in the same amount to every sample and standard. Comparing the analyte’s signal to the internal standard’s signal corrects for injection variation, instrument drift, and some preparation losses.
Q19. What is a blank in analytical chemistry?
A blank is a sample that goes through the entire procedure without the analyte. It reveals contamination from reagents, glassware, or the instrument, so you can correct for or eliminate it.
Q20. What is a certified reference material?
It’s a material whose composition has been established by rigorous, traceable methods and comes with a certificate stating values and uncertainties. Labs analyze it to prove their methods give correct answers.
Q21. How does analytical chemistry help in food safety testing?
Labs test foods for pesticide residues, heavy metals, mycotoxins, antibiotics, allergens, and adulterants. Techniques like LC-MS/MS, ICP-MS, and HPLC make sure products meet legal limits and are what the label claims.
Q22. How is analytical chemistry used in medicine?
It underpins blood and urine tests, newborn screening, therapeutic drug monitoring, and diagnostic sensors. Analytical methods also check the purity and potency of the medicine’s doctors prescribe.
Q23. How does analytical chemistry protect the environment?
It measures pollutants in water, air, and soil, such as lead, arsenic, nitrate, particulates, and pesticides. These measurements guide regulation, cleanup, and public health warnings.
Q24. How is analytical chemistry used in forensic science?
Forensic labs use GC-MS, LC-MS/MS, IR, and elemental analysis to identify drugs, poisons, accelerants, gunshot residue, paint, fibers, and glass, and to measure blood alcohol.
Q25. What role does it play in the pharmaceutical industry?
Analytical chemists verify identity, strength, purity, and stability of every batch. They develop and validate methods, test for impurities, and run dissolution studies that show a tablet will release its drug properly.
Q26. What is the difference between classical and instrumental methods?
Classical methods such as titration and gravimetry depend on chemical reactions and simple measurements. Instrumental methods measure physical properties like light absorption or ion mass. Neither is better; the choice depends on the question.
Q27. What is green analytical chemistry?
It’s an approach that reduces the environmental footprint of analysis by using less solvent, producing less waste, using safer reagents, and miniaturizing methods, all while keeping results reliable.
Q28. What careers are available in analytical chemistry?
Common paths include quality control and method development in pharma, food and environmental testing, forensic science, clinical laboratories, research, regulatory affairs, and technical roles at instrument manufacturers.
Q29. What skills and subjects do I need to work in analytical chemistry?
A solid base in general, organic, and physical chemistry helps, along with statistics, careful lab technique, and attention to documentation. Familiarity with HPLC, GC, and spectroscopy is a big advantage.
Q30. Is analytical chemistry hard to learn?
It rewards patience more than genius. The concepts are approachable, but good results demand careful technique and statistical thinking. Starting with hands-on titrations and calibration curves makes the rest much easier to follow.
Most of what keeps us safe is invisible. We don’t see lead in water, impurities in a tablet, or a toxic additive in milk, and we would never know about them without someone measuring carefully and reporting honestly. That’s the real job of analytical chemistry. It isn’t just instruments and equations. It’s the habit of asking what is in this, how much, and how sure are we, then refusing to settle for a guess.
Pick one idea from this guide and put it to work this week. Build a calibration curve for the first time, rework the vinegar titration with your own numbers, or look up how your local water utility publishes its test results. If this explainer helped, share it with a student or colleague who’s staring at a chromatogram right now, and visit matrixtecheducare.com for more clear, practical science guides.
⚠️ Disclaimer: This blog post is for educational purposes only and does not substitute professional scientific, academic, or medical advice. Simplifications have been made for clarity. Numerical values are approximate. Students should rely on their curriculum and instructors; professionals should verify against peer-reviewed sources. The author assumes no liability for errors or consequences arising from use of this information.